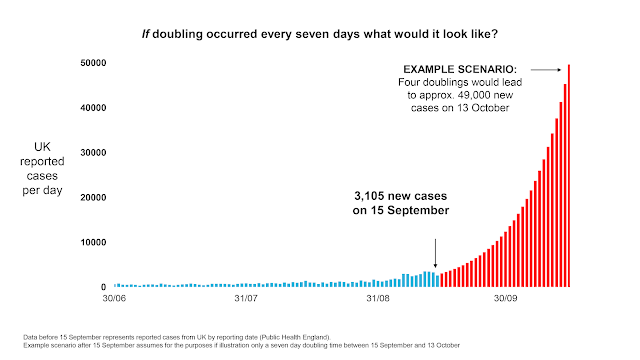
Analysis of SARS-CoV-2 growth illustration presented at Vallance-Whitty Downing Street Briefing on 21 Sep 2020
ANALYSIS OF SARS-CoV-2 GROWTH ILLUSTRATION
PRESENTED AT VALLANCE-WHITTY
DOWNING STREET BRIEFING ON 21 SEP 2020
[26 Sep 2020v1]
Implied CFR appears to be >50% lower than IFR used by ICL in March, suggesting new cases in red area would lead to ~2,000 deaths (~5% of spring total).
The red area would contain a total of ~500,000 new cases.
How many deaths would be expected to occur as a result?
PV commented that, by mid October, there might be 50,000 new cases per day & that this would be expected to lead, a month or so later, to 200 plus deaths per day.
This implies a Case Fatality Rate of approx:
CFR = 200 / 50,000 = ~ 0.4%.
Since not all infections are detected, the Infection Fatality Rate (IFR) will be lower still.
This ~0.4% CFR is, however, in itself 50%+ lower than the 0.9% IFR used in ICL’s March paper & modelling.
Total deaths resulting from the new cases that occurred during the red period would be:
~500,000 x 0.4% = ~2,000 deaths.
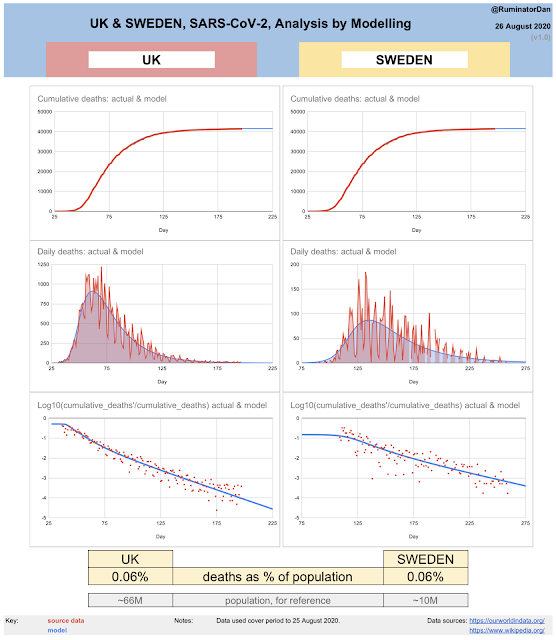
This is equivalent to 5% of the spring total.
SUMMARY:
1) Implied CFR of ~0.4% appears to be at least 50% lower than IFR used in ICL March 2020 paper & modelling.
2) Total deaths caused by new cases occurring during the red period would be significantly lower than the spring total (~2,000, about 5% of the spring total).


