Posts

Showing posts from September, 2020

Analysis of SARS-CoV-2 growth illustration presented at Vallance-Whitty Downing Street Briefing on 21 Sep 2020

Image
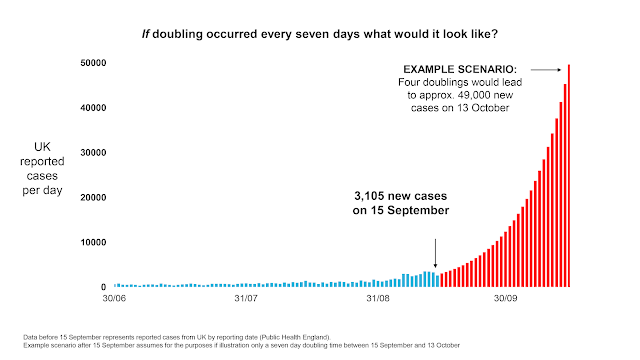
ANALYSIS OF SARS-CoV-2 GROWTH ILLUSTRATION PRESENTED AT VALLANCE-WHITTY DOWNING STREET BRIEFING ON 21 SEP 2020 [26 Sep 2020v1] Implied CFR appears to be >50% lower than IFR used by ICL in March, suggesting new cases in red area would lead to ~2,000 deaths (~5% of spring total). The red area would contain a total of ~500,000 new cases. How many deaths would be expected to occur as a result? PV commented that, by mid October, there might be 50,000 new cases per day & that this would be expected to lead, a month or so later, to 200 plus deaths per day.  This implies a Case Fatality Rate of approx: CFR = 200 / 50,000 = ~ 0.4%. Since not all infections are detected, the Infection Fatality Rate (IFR) will be lower still. This ~0.4% CFR is, however, in itself 50%+ lower than the 0.9% IFR used in ICL’s March paper & modelling.  Total deaths resulting from the new cases that occurred during the red period would be: ~500,000 x 0.4% = ~2,000 deaths. This is equivalent to 5% of the spri

We are all capable of good and bad - dangerous to be creating so much fertile soil for the bad

We are all capable of good and bad - dangerous to be creating so much fertile soil for the bad We look at the past and only ever picture ourselves as one of those rare individuals standing up against the 'baddies'; or at least as one of the 'goodies'. Nonsense. We're all capable of good & bad. Very dangerous, therefore, to be creating so much fertile soil for the bad. @RuminatorDan

False Positives mean R can never reach zero and will remain around 1 indefinitely

Image
False Positives mean R can never reach zero and will remain around 1 indefinitely If prevalence was low enough that most positives were false, cases would appear to stop falling & settle at a low level (+noise). R would rise from below 1 to around 1 & jump around at that level. Indefinitely. E.g. below. % of positive tests declines; then settles at a low but non zero level. If R is determined by the changes in this number (slope of graph) it would be <1 during decline, then rise & settle around 1 but with significant variation due to noise etc being larger at low levels. @RuminatorDan